Author: Alex
-
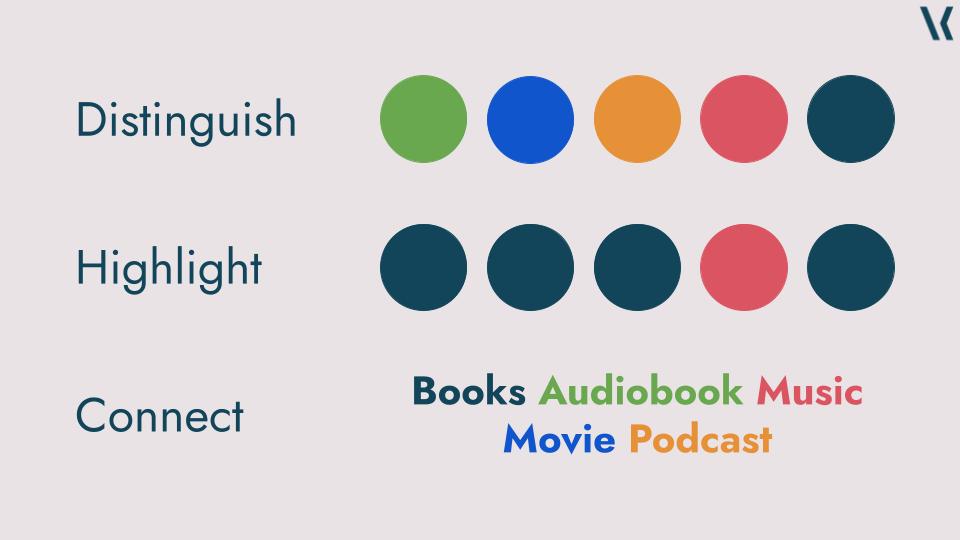
50 Shades of Grey
How to dominate your use of colour! I created a presentation about the use of colour in data visualisation for the virtual Analytics Tableau User Group. Below you’ll find all slides, including links to further resources and a recording of the talk, once it is available. The slides on their own are probably not super…
-

Plot Twist: Navigating Change
Working with clients who are resistant to change is difficult. Here is an idea on how to reframe the situation to be more successful.
-
The Future of Tableau!?
Disclaimer: What follows is my personal take on these announcements, all of these assumptions and predictions were made based on the webinar itself and my experience with the platform. We will see how accurate those are in a few months I guess. Unless you spent the last few weeks under a rock, you will have…
-

The Self-Funding Guide to Tableau Conference – 2024
This is an update of last years post about funding your trip to Tableau Conference. If you consider self-funding or even want to bring the cost down for your company so they are more likely to fund your trip, you might find some valuable tips in here.
-
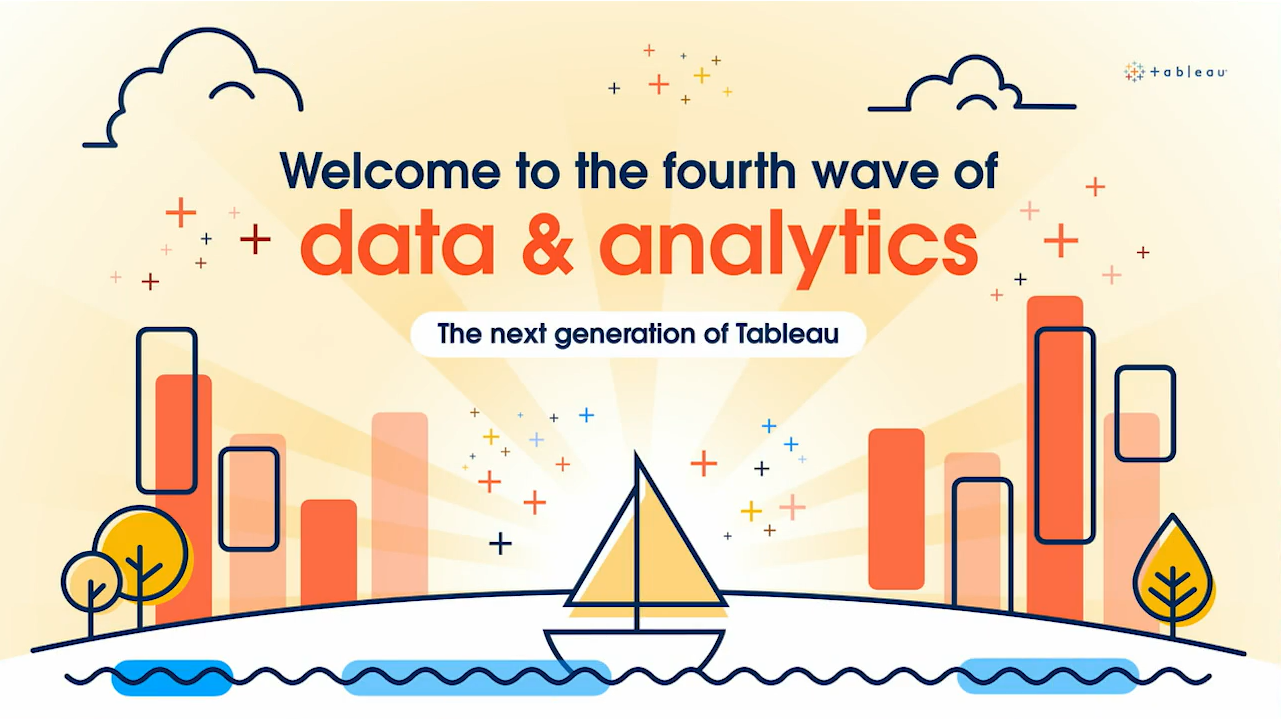
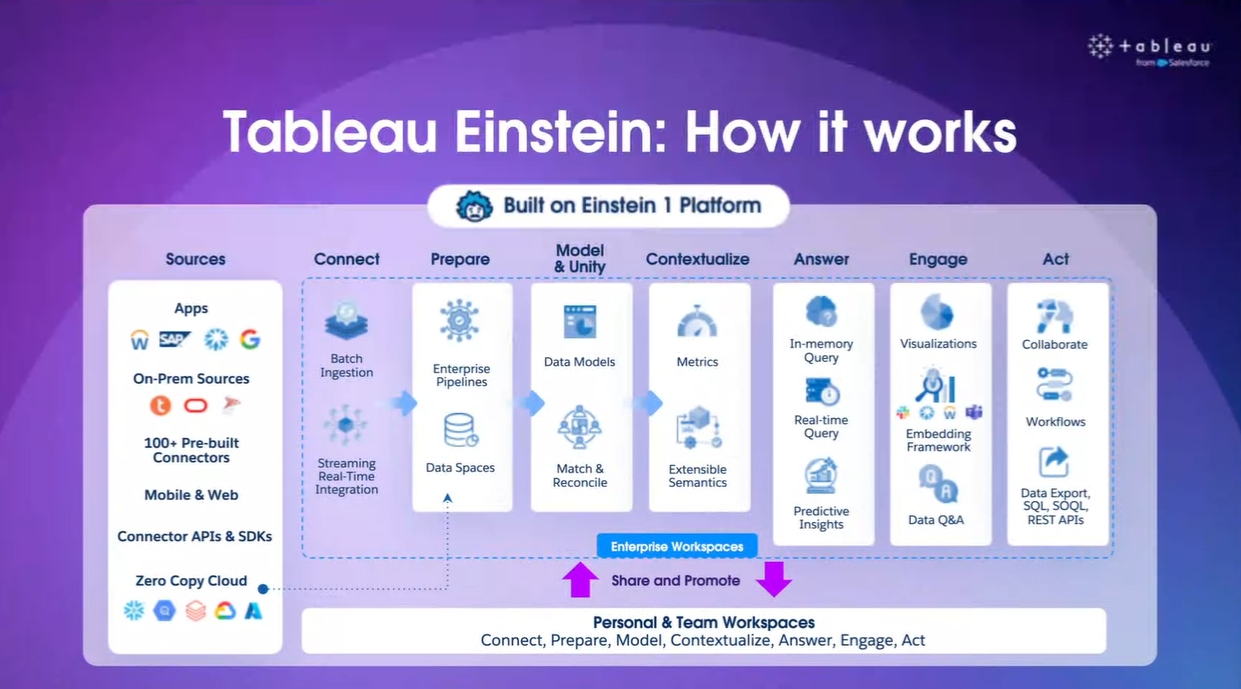
Where does Tableau’s 4th wave take us?
Tableau presented their vision for the 4th wave of analytics at this year’s Tableau Conference. Does that mean a redevelopment of the platform? How does it fit in with Salesforce? And will we all be replaced by AI?
-

Think like a hacker pt. 3 – Break things!
Do you have a little destructive voice in your head? Put it to something constructive and try to break your dashboards and workflows to make sure they are robust. I show you how .
-
Think like a hacker pt. 2 – Anticipate the future!
You probably don’t have a (working) crystal ball; however you should still anticipate what might be happening in the future when developing data assets.
-
Think like a hacker pt. 1 – Never do it more than twice!
Keen to improve your data development skills? Start with this fundamental concept to not do things more than twice but rather refactor to make maintenance and further development easier.
-

The Self-Funding Guide to Tableau Conference
This year’s Tableau Conference is over; 8,000 people are back home and most of them are hopefully inspired and energised or have at least learned some valuable new thing about Tableau and data. For me it was the 3rd Tableau Conference I attended and the 3rd time I fully self-funded my trip. If you had…
-
Becoming Data-Driven through UX – The Power of Empathy
This is a summary of my presentation at TC23 of the same title, while it was prepared for a Tableau event, it is entirely tool independent; in fact all aspects of it apply similarly to any other solutions you would want to design, websites, apps, products, etc. Below you’ll find a written summary of the…
-
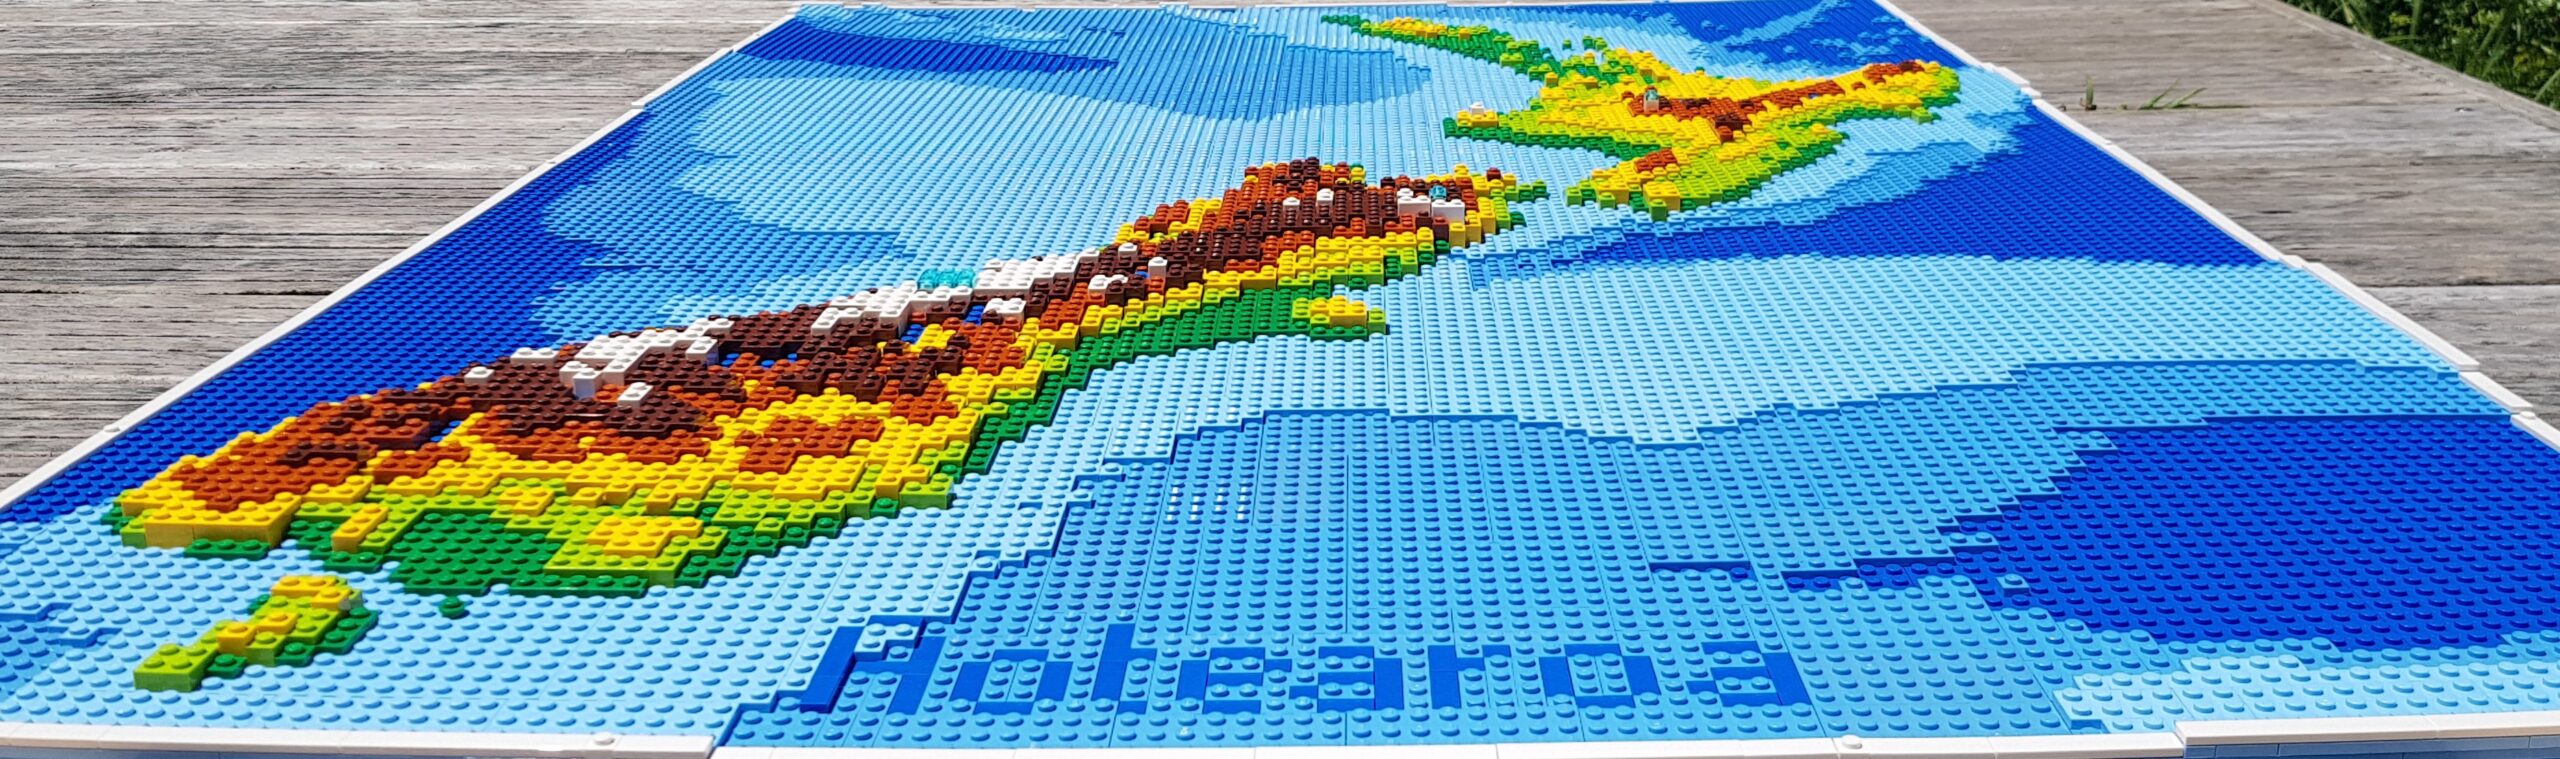
Building Physical Maps…with LEGO
This post first appeared in the Data Visualization Society’s Medium publication “Nightingale” as part of their “Data Sensification” series. The content is the same with the exception of a little update at the end. In the beginning of 2020 I decided to attempt using LEGO bricks as a map-building material for a map of Aotearoa…
-
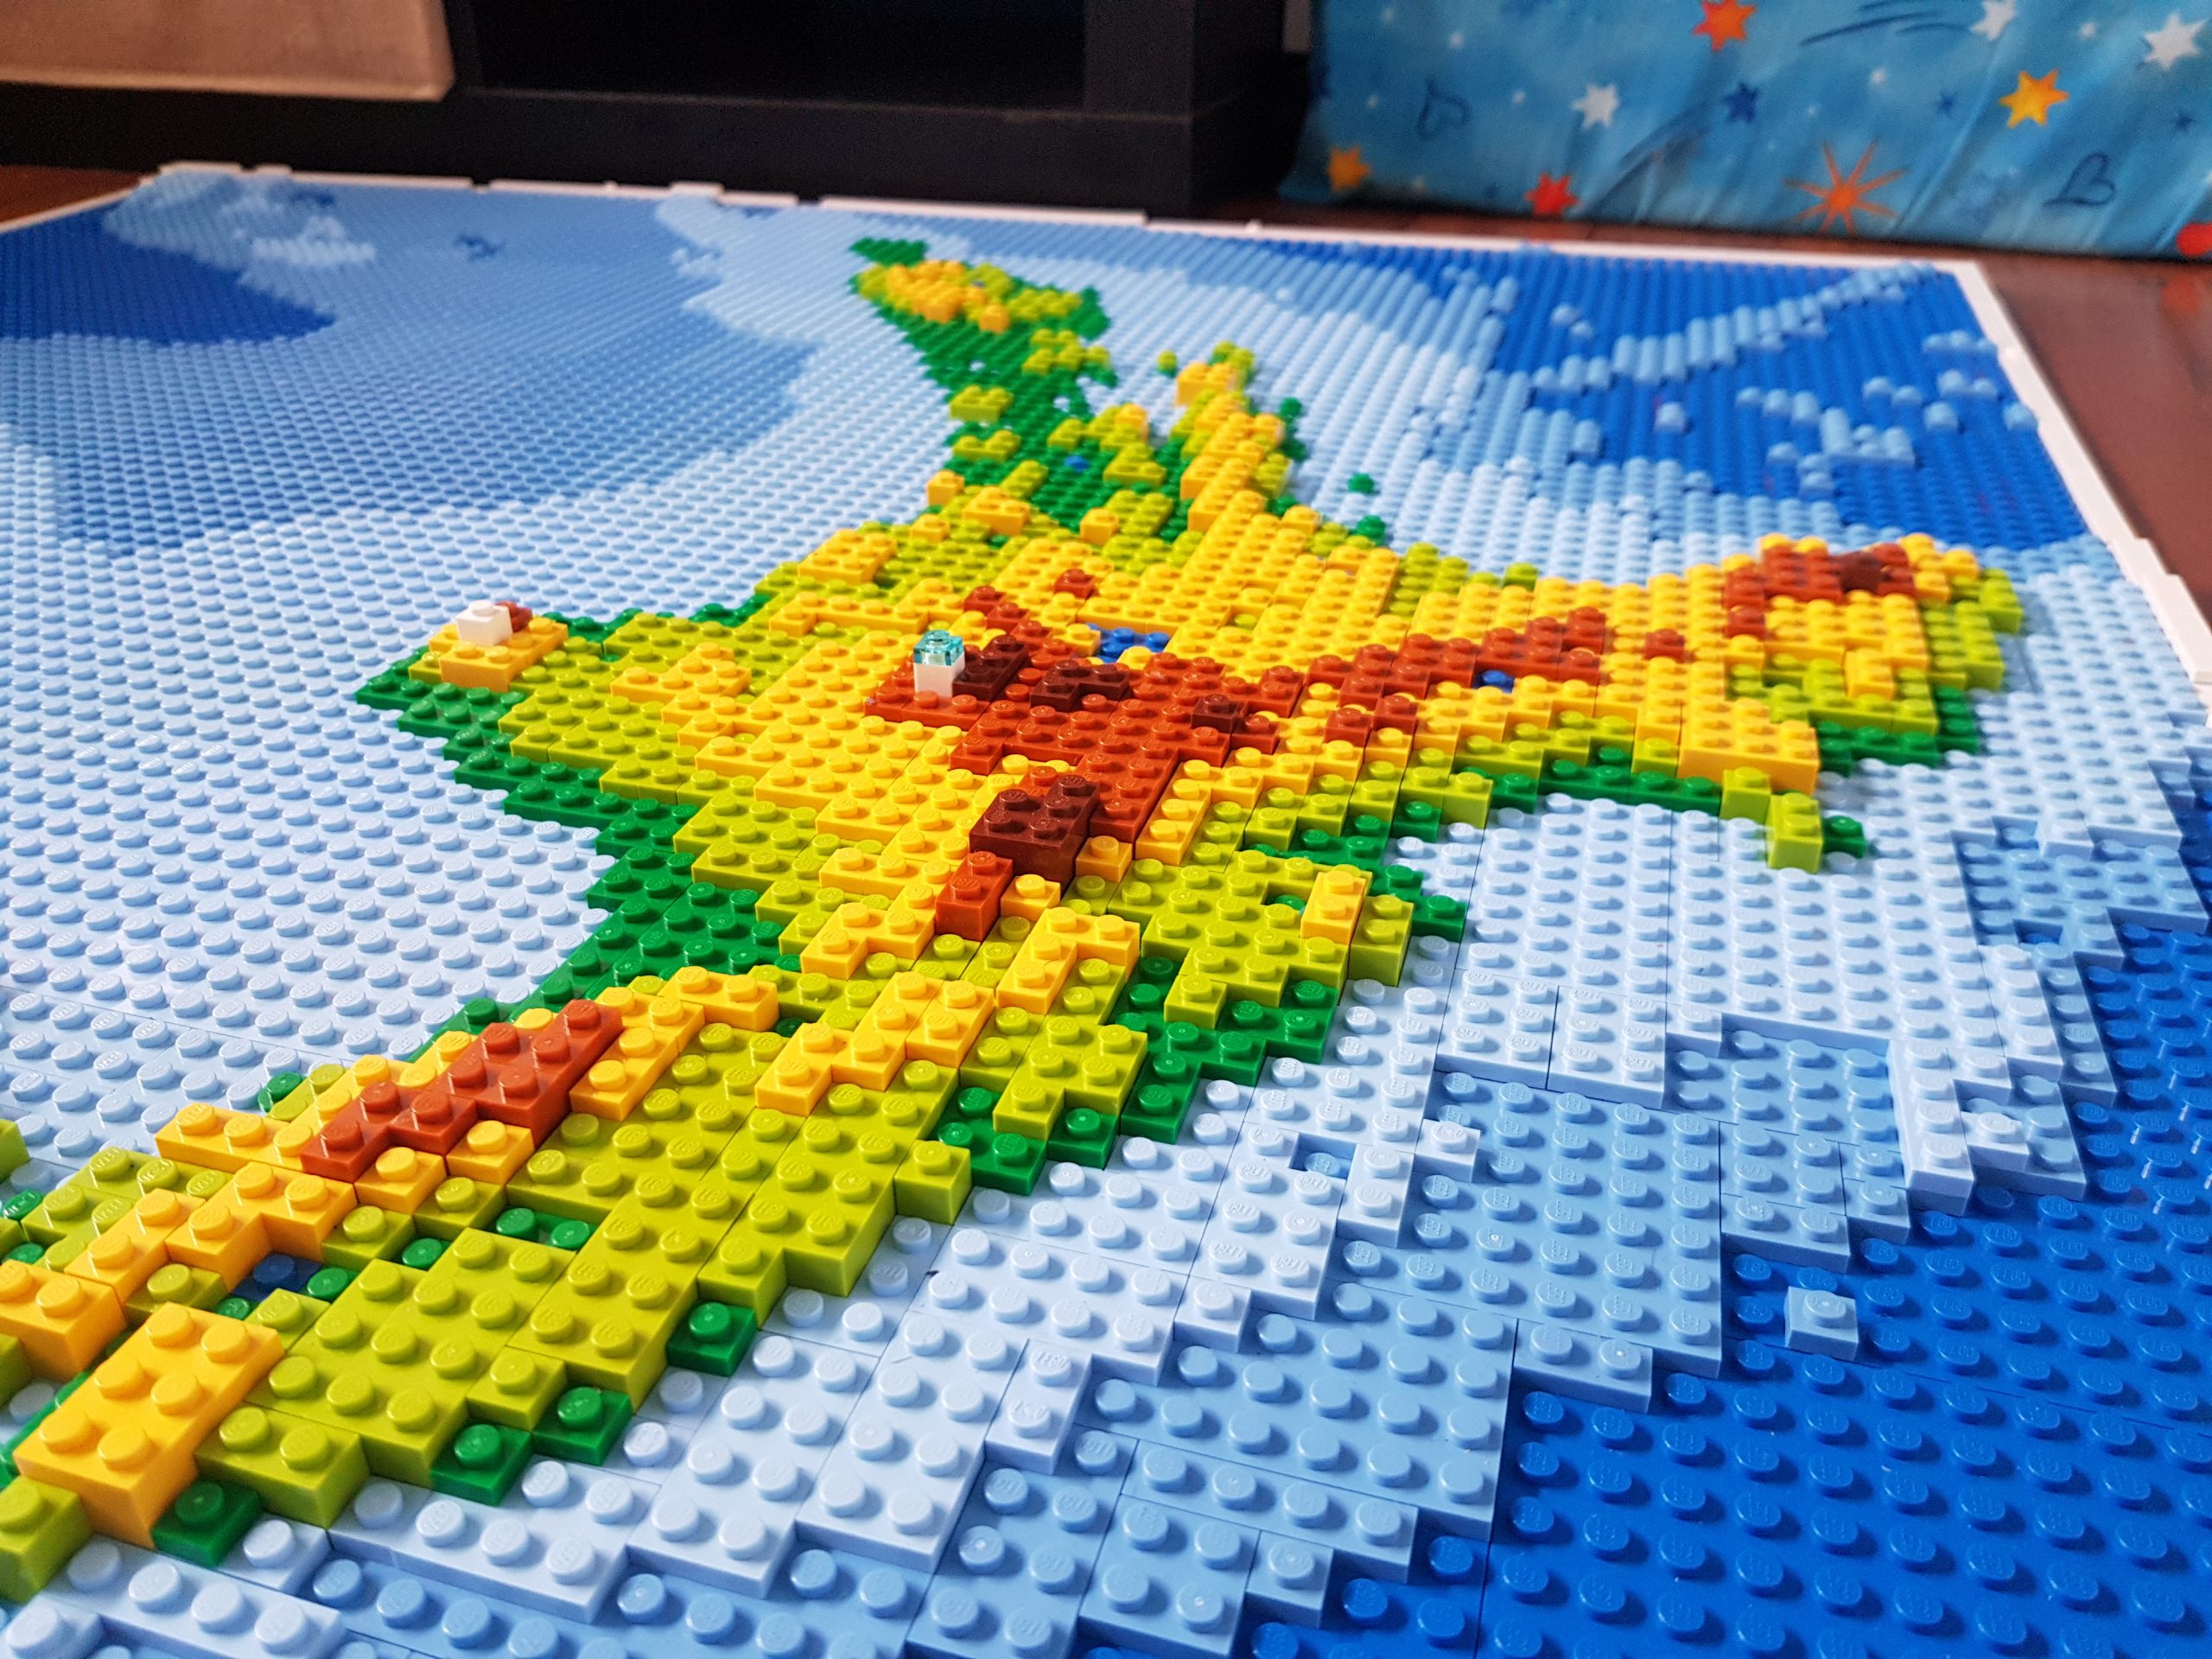
New Zealand LEGO Map
People sometimes have weird ideas. This was definitely one of them. I didn’t even set out to build a LEGO map of New Zealand…it just happened. In January this year I was working on something completely unrelated, based on a quick map I did a bit earlier. I had created a map in Tableau but…